Measuring Our Progress
DRIVING TOWARD 2 MILLION BY 2030
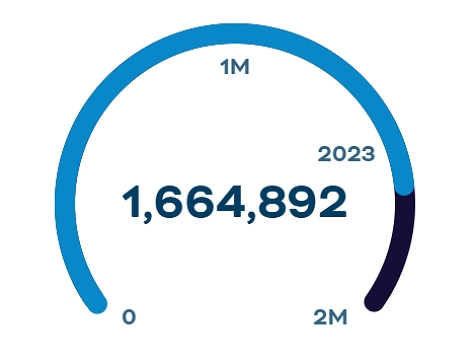
North Carolina faces a growing need for talent. More people must earn degrees or non-degree, industry-valued credentials. myFutureNC tracks the postsecondary attainment of North Carolinians ages 25-44, as well as performance from Pre-K to college and career.
1,722,433 North Carolina adults ages 25–44 hold a degree or industry-valued credential, according to the 2024 American Community Survey released by the U.S. Census Bureau in December 2025.
About the dashboard