Percentage of North Carolina 8th grade students who performed at or above the NAEP Proficient level in math
Last updated: 2024
= Top southern state :
only available for totals, not available for all indicators
What does NAEP 8th Grade Math mean?
The share of North Carolina 8th graders scoring “at or above proficient” on the National Assessment of Educational Progress (NAEP) Mathematics Assessment. NAEP Proficient means students have demonstrated “competency over challenging subject matter.”
What does this data show?
Thirty-one percent of North Carolina’s 8th grade students scored at or above proficient on the NAEP 8th grade math assessment, placing our state 14th among all states in 2024 and the top-performing southern state. Nationally, Massachusetts had the highest shares of 8th grade students earning proficient scores on the NAEP math exam (37%).
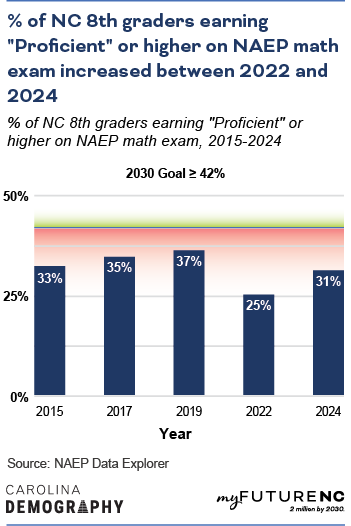
By 2030, the goal is that 42% of North Carolina’s 8th grade students will demonstrate math proficiency on the NAEP assessment. This goal was set by the myFutureNC Commission; while this is a seemingly small numeric increase, it represents a potentially significant improvement in state performance on this indicator.
Why does NAEP 8th Grade Math matter?
Math learned in elementary school and middle school provides a foundation for high school math, which is critical for future attainment and success in the labor market. Success in 8th grade math is a key milestone which indicates whether students are prepared for high school math classes. Research has shown that students who complete more and higher levels of math classes are more likely to graduate from high school and college and have higher earnings in life.
The entry for NAEP in the Encyclopedia of Quality of Life and Well-Being Research notes: “NAEP is often referred to as the Nation’s Report Card, a common ‘yardstick’ that provides data on how states, districts, and various student groups perform against common achievement standards and compare to each other in terms of these standards.”
Data from NAEP provide a common measure of student achievement across the nation and are used to inform educational policy and practice.
How is North Carolina performing?
Meeting the 2030 Goal
North Carolina needs another 11% of 8th graders to score at or above proficiency on the NAEP math assessment to meet the statewide NAEP 8th grade math goal.
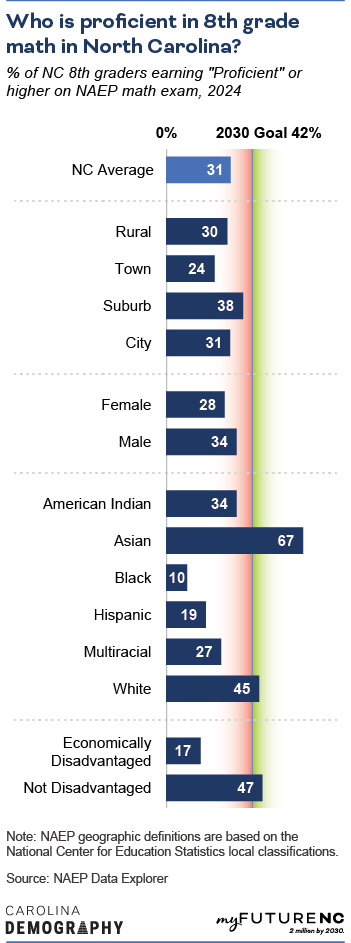
In 2024, 31% of NC 8th graders scored at or above proficient on the NAEP mathematics assessment.
Trends
From 2015 to 2019, the percent of NC 8th grader who scored at or above proficient on the NAEP math assessment increased from 33% to a high point of 37%. After reaching a low of 25% in 2022, in 2024 the score increased by 6 percentage points to 31%.
By geography
Note: NAEP geographic definitions are based on the National Center for Education Statistics local classifications detailed here.
Students from North Carolina’s suburban school districts had the highest scores on the NAEP 8th grade math assessment in 2024 at 38% followed by students in city school districts (31%) and students in rural school districts (30%). North Carolina 8th graders in town school districts had the lowest scores in 2024 with 24%.
By sex
Male students were more likely to score at or above proficient on the NAEP 8th grade math assessment (34%) compared to female students (28%).
By race/ethnicity
Asian students (67%) were the most likely to score at or above proficient on the NAEP 8th grade math assessment followed by White students (45%). Asian and White students were the only racial or ethnic groups to exceed the statewide goal of 42%. Multiracial students (27%), Hispanic and American Indian students (both at 19%), and Black students (10%) were well below the statewide goal for proficiency on the NAEP 8th grade math exam.
By economic disadvantage
Students who were economically disadvantaged—meaning they received free or reduced price lunch—were less likely to score at or above proficient compared to their more affluent peers. Almost half (47%) of students who were not economically disadvantaged scored at or above proficient on the NAEP 8th grade math exam, almost three times the 17% of economically disadvantaged students who reached the same benchmark.
Methodology
Where does the data for NAEP 8th Grade Mathematics come from?
Eighth grade math assessment scores for all states were obtained from the NAEP Data Explorer .
How was the data calculated?
This number is a direct download from NAEP. It is the number of 8th grade students scoring at or above NAEP proficient in Mathematics divided by the total number of 8th grade students assessed. Because of rounding, the numbers might be slightly different than numbers published by other sources.
Information about the NAEP Mathematics Scale Scores and Math Achievement Levels for Eighth Grade are available online.
Who is included?
NAEP is a sample survey that is designed to be representative of all schools nationally and all public schools at the state level. More information on the sample is available here.
Who isn’t included?
NAEP data does not include home school students. State data does not include private school students. Among public school students, some students with disabilities and some English Language Learners may not have been able to participate.
Learn more
Who is working on this in NC?
Help improve this section
If you know of an organization that is working on this topic in NC, please let us know on the feedback form.
NC-focused, state-level dashboards
Name: NC School Report Cards
Website: https://ncreportcards.ondemand.sas.com/src
About: North Carolina’s school report cards are an important resource for parents, educators, state leaders, researchers, and others, providing information about school- and district-level data in a number of areas. These include student performance and academic growth, school and student characteristics, and many other details.
Name: NC Chamber Dashboard
Website: https://ncchamber.com/dashboard/
About: The NC Chamber Dashboard informs dialogue and catalyzes action to address North Carolina’s economic development challenges and opportunities. It provides independent and objective data on leading indicators in four critical areas important for state and business competitiveness.
Further research and literature
Adelman, C. (2006). The Toolbox Revisited: Paths to Degree Completion From High School Through College. Washington, DC: U.S. Department of Education.
Altonji, J. G. (1995). The effects of high school curriculum on education and labor market outcomes. The Journal of human resources, 30(3), 409–438.
Duncan, G. J., Dowsett, C. J., Claessens, A., Magnuson, K., Huston, A. C., Klebanov, P., Pagani, L. S., et al. (2007). School readiness and later achievement. Developmental Psychology, 43(6), 1428–1446.
Loveless, T. (2016, June 13). The NAEP proficiency myth. Brown Center Chalkboard. Retrieved December 10, 2019, from https://www.brookings.edu/blog/brown-center-chalkboard/2016/06/13/the-naep-proficiency-myth/
Murnane, R. J., Willett, J. B., & Levy, F. (1995). The growing importance of cognitive skills in wage determination. The review of economics and statistics, 77(2), 251.
Rose, H., & Betts, J. R. (2001). Math Matters: The Links Between High School Curriculum, College Graduation, and Earnings. San Francisco, CA: Public Policy Institute of California.
Siegler, R. S., Duncan, G. J., Davis-Kean, P. E., Duckworth, K., Claessens, A., Engel, M., Susperreguy, M. I., et al. (2012). Early predictors of high school mathematics achievement. Psychological Science, 23(7), 691–697.
FAQ
How often are NAEP assessments given?
NAEP assessments are conducted every two years.
Is the NAEP Proficient level equivalent to being “on grade level?”
No. NAEP proficiency means students have demonstrated “competency over challenging subject matter” and are set much higher than grade level. Achieving NAEP proficiency is not the same as being “on grade level,” which refers to how students perform on local curriculum and standards.” This means that students who test at the NAEP ‘Basic’ level might still be actually reading at a 4th grade level.