Percentage of students beginning postsecondary education at a North Carolina 2-year public institution who complete a degree or credential within 6 years
Data year: 2025
= Top southern state :
only available for totals, not available for all indicators
What does Postsecondary Completion Rate: 2-Year Public Institutions mean?
Percent of students beginning postsecondary education at a North Carolina Community College System (NCCC) school (2-year public institution) who complete a degree or credential from any institution within 6 years. These rates were updated in 2025, referring to students who began their postsecondary studies in 2019.
What does this data show?
North Carolina’s postsecondary completion rate for students who began at a 2-year public institution was 50% in 2025, placing our state 15th among all states. In Georgia, the top-performing Southern state, the 2-year public postsecondary completion rate was 54%. In South Dakota, the top-performing state overall, this rate was 72%.
By 2030, the goal is to have 45% of students who begin college at an NC community college complete a degree or credential within six years. North Carolina is currently exceeding this goal which was set by the myFutureNC Commission.
Why does Postsecondary Completion Rate: 2-Year Public Institutions matter?
The postsecondary completion rate represents the rate at which degree- or credential-seeking students complete their studies in a timely fashion. This is partly “a measure of the efficiency with which students complete college.” Specifically, high completion rates mean:
- more degree production, which is beneficial for economic competitiveness; and
- a smoothly functioning postsecondary system that can serve more students.
Lower completion rates have costs both to individual students and the communities in which they live. Students who do not complete on time:
“experience costs in terms of receiving lower average earnings, having student debt, and losing time while enrolled in school. Additionally… students who fail to complete a college credential are less likely to go on to work in occupations that offer employment benefits (such as health insurance and pension plans), earn family-sustaining wages, or be civically involved.”
How is North Carolina performing?
Meeting the 2030 Goal
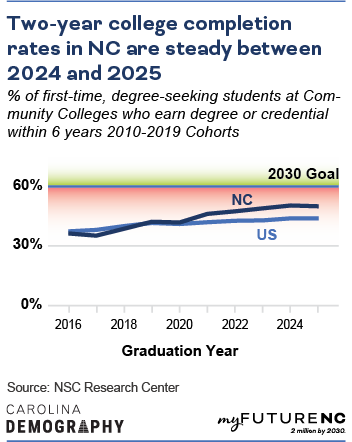
North Carolina met its 2-year public completion rate goal in 2025, with a 50% postsecondary completion rate for students who began at a 2-year public institution.
North Carolina’s postsecondary completion rate of 50% for 2-year public institutions means that 5 out of 10 students who began postsecondary education at one of North Carolina’s community colleges in the fall of 2019 completed a degree or credential by 2025. This completion rate was seven percentage points above the national average (43%), and five percentage points above North Carolina’s 2030 goal (45%) set by the myFutureNC Commission.

Which NC community college students graduate in 6 years?
Trends
The postsecondary completion rates for community college students in North Carolina have improved over time. For students who started at a two-year public institution in 2010, 33% of students completed college within six years compared to 50% of students in the 2019 cohort. The completion rates in North Carolina have also been consistently higher than the U.S. overall since the 2014 starting cohort. In 2025, the U.S. overall completion rate was 44%, compared to 50% in North Carolina.

By sex
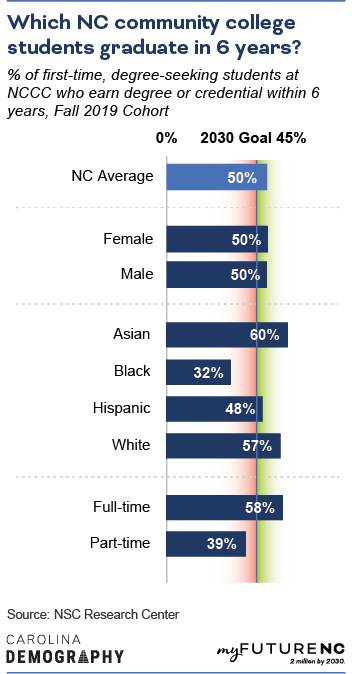
Both female students and male students had a postsecondary completion rate of 50% in 2025.
By race/ethnicity
Among the racial/ethnic groups included the the National Student Clearing House state completion data, Asian students who began postsecondary studies at a North Carolina community college had the highest postsecondary completion rate: 60% completed a degree or credential within six years. White students (57%) had the next highest rate followed by Hispanic (48%) and Black (32%) students.
By enrollment status
NC community college students who were enrolled full-time were the most likely to complete a degree or credential within six years (58%). In contrast, about two in five students enrolled part-time (39%) earned a degree within six years, indicating the importance of full-time enrollment for timely degree completion.
Methodology
Where does the data for postsecondary completion come from?
The data for completion rates by state was downloaded from the National Student Clearinghouse (NSC) Research Center.
The NSC is a nonprofit organization that provides postsecondary enrollment data and verification for more than 3,600 colleges and universities in the United States.
How was the data calculated?
This was a direct download from the NSC Research Center.
Who is included?
From NSC: “first-time-in-college degree-seeking students who started their postsecondary studies at U.S. colleges and universities in the fall of 2019.”
The NSC data includes transfer students.
Who isn’t included?
Non-first-time students, non-degree-seeking students, students who began postsecondary during summer or spring terms, and students who began postsecondary at an institution outside of the United states are not included. Full details on data exclusions are available here.
State-level data is not reported for states with fewer than three postsecondary institutions in a sector.
Collectively, the institutions covered by the NSC data serve 97.5% of all postsecondary students nationwide and 99.1% of students in North Carolina. The NSC data does not cover all institutional sectors equally, however, and has lower coverage rates of for-profit institutions. More detail on NSC coverage is available here.
The data used in the development of this indicator is derived from administrative records and is subject to non-sampling error.
Learn more
Who is working on this in NC?
Help improve this section
If you know of an organization that is working on this topic in NC, please let us know on the feedback form.
NC-focused, state-level dashboards
Name: NCCCS Dashboards
Website: https://www.nccommunitycolleges.edu/analytics/dashboards
About: The North Carolina Community College System (NCCCS) dashboards allow users to explore and interact with NCCCS data by theme. The dashboards are designed to help colleges access the data and information needed to facilitate institutional effectiveness and program improvement. Dashboards include system and college-level data views, disaggregations, historical trends, and peer comparisons.
Name: NC Tower
Website: https://www.nctower.com/home
About: NC TOWER is a web-based delivery system providing aggregate information on students who attended public universities and community colleges in North Carolina. These data include programs of study, degrees attained, further enrollment, and wage and employment information.
Further research and literature
Bailey, M., & Dynarski, S. (2011). Gains and gaps: changing inequality in U.S. college entry and completion. Cambridge, MA: National Bureau of Economic Research.
Burrus, J., Elliott, D., Brenneman, M., Markle, R., Carney, L., Moore, G., Betancourt, A., et al. (2013). Putting and Keeping Students on Track: Toward a Comprehensive Model of College Persistence and Goal Attainment. Princeton, NJ: ETS.
Long, B. T. (2018). The College Completion Landscape: Trends, Challenges, and Why it Matters. Washington, DC: Third Way.
Shapiro, D., Dundar, A., Huie, F., Wakhungu, P. K., Bhimdiwala, A., & Wilson, S. E. (2018). Completing College: A National View of Student Completion Rates – Fall 2012 Cohort (Signature Report No. 16). Herndon, VA: National Student Clearinghouse Research Center.
Tippett, R., & Kahn, N. (2018a). Postsecondary Completion Report: 2009-2011 North Carolina Public High School Graduates. Raleigh, NC: myFutureNC.
Tippett, R., & Kahn, N. (2018b). Postsecondary Pathways & Barriers to Opportunity Report: 2009-2011 NC Public High School Graduates. Raleigh, NC: myFutureNC.
FAQ
Who is identified as a first-time student?
The National Student Clearinghouse defines first-time students as individuals who “Did not have a previous enrollment record, as shown in the Clearinghouse data, prior to the first day of enrollment in the fall of the corresponding cohort year, unless the previous enrollment record was before the student turned 18 years old (qualified as former dual enrollment students).” This analysis further excluded individuals who had previously received “any credential from a postsecondary institution prior to the first day of enrollment in the fall of the corresponding cohort year, according to Clearinghouse data, unless the award date was before the student turned 18 years old (former dual enrollment)” or did not have “at least one legitimate enrollment status throughout the study period; that is, enrolled for at least one term with full-time, part-time (i.e., halftime or less than half-time), or withdrawal status”. As of the 2024 report, two changes were made impacting the completion rates: “1) current dual enrolled students were excluded, [and] 2) data enhancements enabled reliable exclusion of students with prior enrollments over a longer historical timeframe (impacting mainly older students).”
Does this indicator include students who may be casual course takers with no intention of earning a degree?
No. The National Student Clearinghouse attempts to limit this analysis to only degree-seeking students and attempt to exclude non-degree-seeking, casual course takers. For students who first enrolled in four-year institutions, degree-seeking students were defined as those who “enrolled at least one term with an intensity of halftime or higher.” Students who started at two-year institutions were identified as non-degree-seeking students if they failed to meet one of the following criteria: ” enrolled at three-quarter-time or full-time for at least one term or half-time for any two terms before December 31 one calendar year after the respective cohort year (e.g. December 31, 2020 for the 2019 cohort).” Nationally, this definition excluded more than 231,223 students who began at two-year institutions.


