Percentage of North Carolina Grade 11 students earning an ACT composite score of 17 or above (UNC minimum)
Data year: 2025
= Top southern state :
only available for totals, not available for all indicators
What does ACT Performance mean?
Percentage of North Carolina 11th grade students earning an ACT Composite score of 17 or above (the minimum score required to be considered for admission at a UNC institution).
What does this data show?
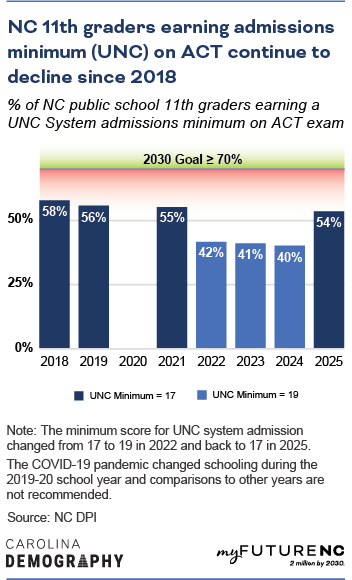
In 2025, 54% of North Carolina public school 11th graders earned an ACT composite score of 17 or higher. Since the 2012-13 school year, the ACT standardized test has been administered to all 11th graders in North Carolina. The ACT exam consists of four core subject tests:
- English
- Mathematics
- Reading
- Science
Possible scores in each subject test range from 1-36. A student’s composite score reflects their average performance on these four subjects. By 2030, the goal is to have 70% of 11th graders earn an ACT composite score of 17 or higher.
Why does ACT Performance matter?
Students earning an ACT composite score of 17 or higher meet the state’s definition of being college-ready: this is the minimum ACT score required for consideration for admission to one of the University of North Carolina System’s 17 university campuses. The minimum ACT score was raised from 17 to 19 beginning in the 2021-22 school year. Scores at or above the threshold are associated with an increased probability of acceptance at a UNC school: in 2018 half of North Carolina residents with an ACT score of 17 were accepted to one of the state’s selective UNC System schools. Beginning in the fall of 2026, the minimum score for admission to a UNC System school is again 17, however only students with a GPA below 2.8 need to submit their scores. In the 2024-25 school year, UNC system schools did not have a minimum ACT score for admission, however students with less than a 2.8 GPA needed to submit their scores to be considered for admission. For the 2024-25 school year, NC’s Department of Public Instruction considered a composite score of 17 in their accountability data.
Research indicates that ACT composite scores are also associated with first-year GPA and degree completion. Nearly half (47%) of students with an ACT score of 17 earn a first-year college GPA of 2.50 or higher. A composite score of 17 is also associated with a roughly 50% chance of associate or bachelor’s degree completion within six years of enrolling in college.
How is North Carolina performing?
Meeting the 2030 Goal
North Carolina needs 17,248 more 11th graders to earn a 17 or higher on the ACT to meet the statewide ACT performance goal.

During the 2024-25 school year, 54% of students earned an ACT composite score of 17 or higher.
Trends
The ACT was first administered to all North Carolina 11th graders during the 2012-13 school year. The minimum ACT composite score for UNC admission was 17 from the 2012-13 school year to the 2020-21 school year. From 2021-22 school year to 2023-24, the minimum score was 19. In the 2024-25 school year no minimum score was required for UNC admission but NC Department of Instruction reported composite scores of 17 or higher. Beginning in fall 2026, the minimum ACT composite score for UNC admission is back to 17. Because of these changes, any trend should be interpreted with caution.
By geography
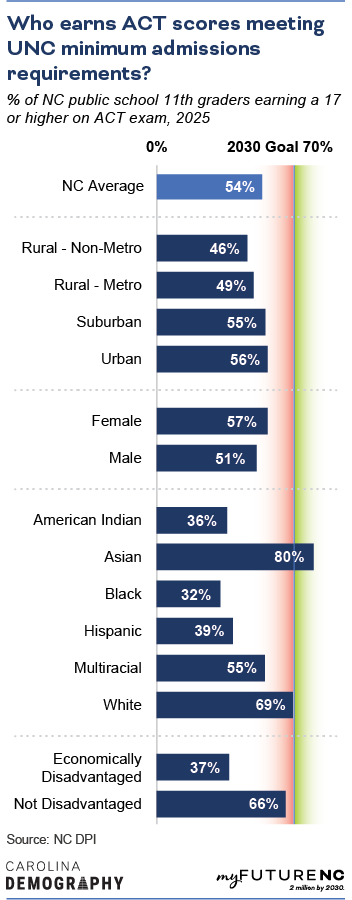
Students from urban counties were the most likely to score 17 or higher on the ACT composite (56%) closely followed by students in suburban counties (55%). Among students from rural counties, students in rural counties in a metropolitan area were more likely to score a 17 or higher on the ACT than students in non-metropolitan rural counties: 49% versus 46%.

By sex
Female students (57%) were more likely to score a 17 or higher on the ACT than male students (51%).
By race/ethnicity
Asian students (80%) were the most likely racial or ethnic group to score 17 or higher on the ACT and were the only student group with average performance meeting the state ACT performance goal. White students (69%) had the next highest performance followed by Multiracial students (55%). Less than one in two of Hispanic (39%), American Indian (36%), and Black students (32%) scored a 17 or higher on the ACT composite in 2025.
By economic disadvantage
Students classified as economically disadvantaged—meaning they received free or reduced price lunch—were less likely to score a 19 or higher on the ACT than students who were not economically disadvantaged. Thirty-seven percent of economically disadvantaged students scored a 17 or higher in 2025, close to half the share of non-economically disadvantaged students (66%).
Methodology
Where does the data for ACT performance come from?
Data for student performance in the 2024-25 school year is reported by the North Carolina Department of Public Instruction (NC DPI).
How was the data calculated?
This is a direct download from NC DPI (2024-25 School Assessment and Other Indicator Data (XLSX)).
Who is included?
All North Carolina public school students in grade 11.
Who is excluded?
Some groups of students were excluded from ACT reporting. According to NC DPI, the following students were excluded: students who were not in grade 11, were identified as limited English proficient in their first year in US schools, repeating grade 11, or had a documented medical exception.
Learn more
Who is working on this in NC?
Help improve this section
If you know of an organization that is working on this topic in NC, please let us know on the feedback form.
NC-focused, state-level dashboards
Name: NC School Report Cards
Website: https://www.dpi.nc.gov/data-reports/school-report-cards
About: North Carolina’s school report cards are an important resource for parents, educators, state leaders, researchers, and others, providing information about school- and district-level data in a number of areas. These include student performance and academic growth, school and student characteristics, and many other details.
Further research and literature
Allen, J., & Radunzel, J. (2017). Relating ACT Composite Score to Different Levels of First-Year College GPA. Iowa City, IA: ACT, Inc.
Lauen, D. L., & Tomberlin, T. R. (2018). North Carolina K-12 Achievement. Raleigh, NC: myFutureNC.
Radunzel, J. (2018). How is the ACT Composite Score Related to the Likelihood that a Student will Complete a College Degree? Iowa City, IA: ACT, Inc.
FAQ
Does the ACT Performance indicator differ from ACT College Readiness Benchmarks?
Yes. Students earning an ACT composite score of 17 or higher meet the state’s definition of being college-ready: this is the minimum ACT score required for consideration for admission to one of the University of North Carolina System’s 17 university campuses.
The ACT College Readiness Benchmarks, as defined by ACT, are the minimum ACT scores required for students to have a high probability of success in credit-bearing first-year college courses. You can read more about the benchmark scores and how the benchmarks were developed.
What is on the ACT and what is the score range?
About the ACT: “The ACT contains four multiple-choice tests—English, mathematics, reading, and science—and an optional writing test. These tests are designed to measure skills that are most important for success in postsecondary education and that are acquired in secondary education. The score range for each of the four multiple-choice tests is 1–36. The Composite score is the average of the four test scores rounded to the nearest whole number.”


