Percentage of North Carolina public high school students graduating within four years
Last updated: 2024
= Top southern state :
only available for totals, not available for all indicators
What does High School Graduation Rate mean?
The high school graduation rate is the percent of public high school students who graduated in four years or less.
What does this data show?
In 2024 North Carolina’s high school graduation rate was 87%. In 2022, the most recent year of data for all states, North Carolina’s high school graduation rate was 86%, placing our state 25th out of all states. In 2022, Tennessee was the top-performing Southern state (90%) and West Virginia had the highest graduation rate (91%) among all states.
By 2030, the goal is that 95% of North Carolina high school students will graduate within four years or less. This goal is aligned with the North Carolina Department of Public Instruction Every Student Succeeds Consolidated State Plan.
Why does High School Graduation Rate matter?
Completing high school on time—meaning graduating in four years or less—is critical for student success. Delays in completion as a result of being held back or a break in enrollment are associated with much higher risks of eventually dropping out.
The economic impact of on-time high school graduation is significant for both individuals and their communities. Students who leave high school without a diploma are less likely to be employed, earn less money, are more likely to engage in criminal activity or require social services, and tend to live shorter and less healthy lives.
Without a diploma, these non-graduates are at a distinct disadvantage: they cannot enroll in postsecondary education and training programs, are not qualified to serve in the military, and earn a national average of $8,000 less annually compared to high school graduates. And for every student who fails to graduate, communities bear the burden of lost skilled labor, tax revenue, and lower economic activity.
How is North Carolina performing?
State-by-state data on graduation rates has been available since 2011 and is released on a slower schedule than North Carolina data from the NC Department of Public Instruction (NC DPI). We can examine national trends from 2011 to 2022 but have data on North Carolina’s performance from 2006 to 2024. The analysis below uses NC DPI data to provide the most up-to-date look at high school graduation rates in North Carolina.
Meeting the 2030 Goal
The state needs 9,928 more ninth graders to complete high school in four years or less to meet the statewide high school graduation rate goal.
In 2011, North Carolina’s graduation rate was 78%,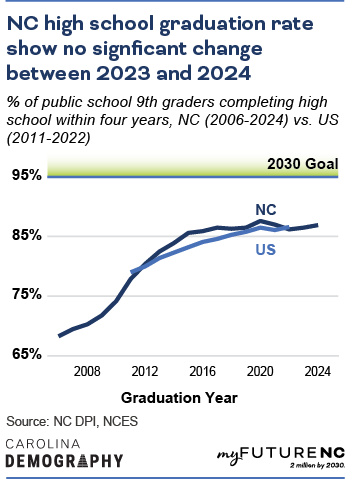
below the national average and 26th among all states. By 2022, North Carolina’s graduation rate had increased to 86%, below the national average of 87% and 25th among all states. In 2024, North Carolina’s graduation rate had increased by one percentage point (87%) compared to 2022.
Trends
The share of ninth graders completing high school in four years has grown by seventeen percentage points since 2006, rising from 69% to 87% in 2024. The current rate has not changed between 2023 and 2024.
As of 2024, North Carolina’s high school graduation rate was eight percentage points below the 2030 goal of 95%.
By geography
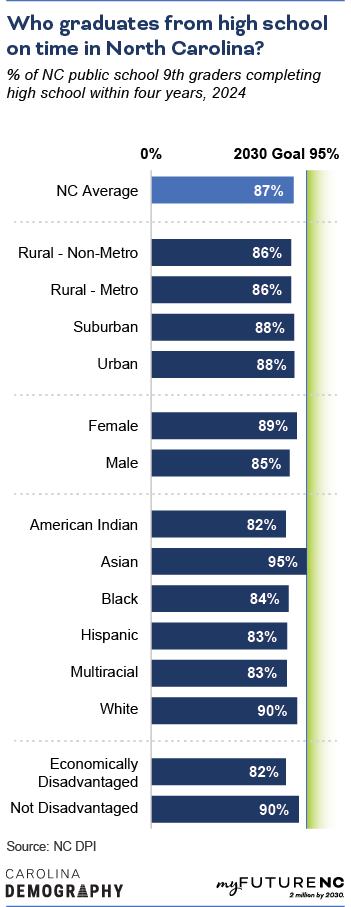 Suburban and urban North Carolina counties had the highest graduation rates in 2024 (88%), followed by both rural non-metro and rural-metro counties (86%).
By sex
Statewide, female students have higher graduation rates than male students: 89% of female ninth graders complete high school in four years or less compared to 85% of male ninth graders.
By race/ethnicity
High school graduation rates were highest for Asian students at 95%; the 2024 graduation rate for this group met the state 2030 goal. White students had the second highest rate (90%), followed by Black students (84%), and both Hispanic and Multiracial students (83%). American Indian students had the lowest graduation rate (82%) in 2024.
By economic disadvantage
Economically disadvantaged students—meaning students receiving free or reduced price lunch—had a high school graduation rate of 82%, eight percentage points lower than the graduation rate among not economically disadvantaged students (90%) in 2024. This gap has increased by four percentage points since 2023.
Methodology
Where does the data for high school graduation come from?
High school graduation rates for all states were obtained from the Common Core of Data from 2011 to 2020 and from the Office of Elementary and Secondary Education (through ED Data Express) since 2021, both maintained by the National Center for Education Statistics. Detailed North Carolina data was downloaded from the North Carolina Department of Public Instruction.
How was the data calculated?
North Carolina data is a direct download from the NC Department of Public Instruction (methodology). State-level data is a direct download from the National Center for Education Statistics.
Who is included?
The 4-year high school graduation rate shows all students in North Carolina who completed high school within 4 years, including students who:
- transferred into the public school system after 9th grade
- earned their diplomas during the summer session immediately following their fourth year of high school.
- enrolled in a Community College Adult High School Program diploma program through an NC community college and earn a high school diploma within four years.
The cohort includes students who have dropped out or are temporarily withdrawn due to suspension or school-approved illness.
Who isn’t included?
Students are removed from the cohort if they:
- are confirmed and documented to have transferred out of the state public school system;
- emigrate to another country;
- transfer to a prison or juvenile facility;
- are deceased; or
- enroll in private schools or home schools.
Students who take more the four years to graduate from high school are not counted as graduates within four years. Students who are awarded a GED or similar credential are not counted as high school graduates.
Learn more
Who is working on this in NC?
Help improve this section
If you know of an organization that is working on this topic in NC, please let us know on the feedback form.
Name: Communities in Schools of North Carolina
Scope: Statewide
Website: https://www.cisnc.org/
About: Established in 1989, Communities In Schools of North Carolina is part of the national Communities In Schools network. From their website: “Communities In Schools believes the formula for student success is ABC+P: attendance, behavior, coursework and parent/family engagement. We work directly inside nearly 300 public schools across the state, creating tailor-made plans for those students with the greatest risk of dropping out. We empower 1.5 million students nationally to stay in school and on the path to graduation each year.”
NC-focused, state-level dashboards
Name: NC School Report Cards
Website: https://ncreports.ondemand.sas.com/src
About: North Carolina’s school report cards are an important resource for parents, educators, state leaders, researchers, and others, providing information about school- and district-level data in a number of areas. These include student performance and academic growth, school and student characteristics, and many other details.
Name: NC Chamber Dashboard
Website: https://ncchamber.com/dashboard/
About: The NC Chamber Dashboard informs dialogue and catalyzes action to address North Carolina’s economic development challenges and opportunities. It provides independent and objective data on leading indicators in four critical areas important for state and business competitiveness.
Further research and literature
Alliance For Excellent Education. (n.d.). The High Cost of High School Dropouts: The Economic Case for Reducing the High School Dropout Rate. Retrieved December 18, 2019, from https://all4ed.org/take-action/action-academy/the-economic-case-for-reducing-the-high-school-dropout-rate/
Guison-Dowdy, A., & Becker Patterson, M. (2011). Journeys through College: Postsecondary Transitions and Outcomes of GED Test Passers. Washington, DC: American Council on Education.
Lehr, C. A., Johnson, D. R., Bremer, C. D., Cosio, A., & Thompson, M. (2004). Increasing Rates of School Completion: Moving From Policy and Research to Practice. A Manual for Policymakers, Administrators, and Educators. Minneapolis, MN: National Center on Secondary Education and Transition.
U.S. Bureau of Labor Statistics. (2018). Unemployment rates and earnings by educational attainment, 2017. Washington, DC: Bureau of Labor Statistics.
U.S. Department of Education. (2015). High School Dropouts and Stopouts: Demographic Backgrounds, Academic Experiences, Engagement, and School Characteristics (NCES 2015-064). Washington, DC: National Center for Education Statistics, Institute of Education Sciences, U.S. Department of Education.
FAQ
Are students who dropout but complete a GED considered high school graduates?
No. In North Carolina, students who dropout but then complete a GED are not considered high school graduates.
Does the data include students who attend private school or home school?
No. This data only reflects outcomes for public school students. Students who began at an NC public school but transfer to private schools or home school have been removed from the cohort and are excluded from the graduation rate. These students may graduate within NC but do so from a private school or home school after transferring. However, these students do not impact the graduation rate because they have been removed from the cohort.