Percentage of North Carolina students in grades 3-8 who earned a college-and-career-ready score on the end-of-grade math exam
Data year: 2025
= Top southern state :
only available for totals, not available for all indicators
What does College-and-Career-Ready in Math mean?
Percent of North Carolina students in grades 3-8 who earned a college-and-career-ready score (4 or 5) on the End-of-Grade Math exam.
What does this data show?
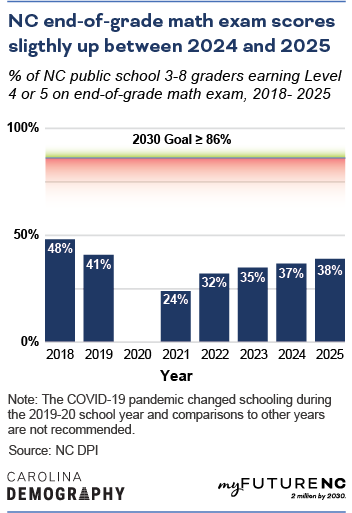
Thirty-eight percent of North Carolina 3rd through 8th graders earned college-and-career-ready scores on the End-of-Grade Math exam in 2025. The North Carolina End-of-Grade Math exams are designed to measure student performance on the goals, objectives, and competencies established as grade-level standards.
By 2030, the goal is to have 86% of students earn college-and-career-ready scores in math. This goal is aligned with the North Carolina Department of Public Instruction Every Student Succeeds Consolidated State Plan.
Why does College-and-Career-Ready in Math matter?
Early math skills are a strong predictor of long-term success in both math and literacy.
The critical thinking, problem solving, and logic skills developed from proficiency in early-grade math prepare students for high school math and ACT scores, where achievement predicts both postsecondary enrollment and completion, as well as well-paying careers and earnings growth over time.
How is North Carolina performing?
Meeting the 2030 Goal
North Carolina needs 337,025 more students to earn a college-and-career-ready score to meet the statewide goal of 86% college-and-career-ready in math.

In 2025, 38% of North Carolina students in grades 3-8 earned college-and-career-ready scores on the math End-of-Grade exam.
Trends
In 2018, 48% of students in grades 3-8 earned college-and-career ready scores in math . The percent dropped to a low of 24% in 2021, but has steadily increased since. In 2025, students earning college-and-career ready scores in math improved to 38%.
By geography
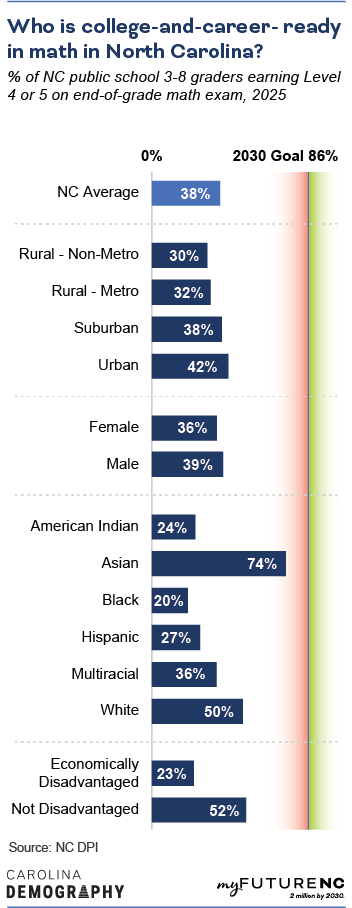
Disparities along the urban-rural continuum persist. Students from urban counties were most likely to earn college-and-career-ready scores in math (42%), followed by students from suburban counties (38%). Among students from rural counties, students in rural counties within metro areas were more likely to earn college-and-career-ready scores in math (32%) compared to students from rural counties outside of metro areas (30%).
By sex

Male students were more likely than female students to earn college-and-career-ready scores in math (39% vs. 36%).
By race/ethnicity
Asian students were the most likely to be college-and-career-ready in math: 74%, followed by White students (50%) and multiracial students (36%). A smaller percentage of Hispanic (27%), American Indian (24%), and Black (20%) students earned college-and-career-ready scores in math in 2025.
By economic disadvantage
Economically disadvantaged students—meaning students receiving free or reduced price lunch—were less than half as likely to earn college-and-career-ready scores in math compared to their peers who are not economically disadvantaged: 23% of economically disadvantaged students earned college-and-career-ready scores compared to 52% of non-economically disadvantaged students.
Methodology
Where does the data for College-and-Career-Ready in Math come from?
Data for student performance in the 2024-25 school year is reported by the North Carolina Department of Public Instruction (NC DPI). Students are classified as “college-and-career-ready” if they score at a Level 4 or higher on the End-of-Grade Mathematics exam.
How was the data calculated?
This is a direct download from NC DPI (2024-25 School Assessment and Other Indicator Data (XLSX)).
Who is included?
All North Carolina public school students in grades 3-8.
Who isn’t included?
Some groups of students are excluded from the proficiency calculations:
- students with an NC DPI approved medical exemption.
- students in their first or second year in a U.S. school.
For complete details on inclusions and exclusions, see the NC DPI Business Rules.
Learn more
Who is working on this in NC?
Help improve this section
If you know of an organization that is working on this topic in NC, please let us know on the feedback form.
NC-focused, state-level dashboards
Name: NC School Report Cards
Website: https://www.dpi.nc.gov/data-reports/school-report-cards
About: North Carolina’s school report cards are an important resource for parents, educators, state leaders, researchers, and others, providing information about school- and district-level data in a number of areas. These include student performance and academic growth, school and student characteristics, and many other details.
Further research and literature
Adelman, C. (2006). The Toolbox Revisited: Paths to Degree Completion From High School Through College. Washington, DC: U.S. Department of Education.
Altonji, J. G. (1995). The effects of high school curriculum on education and labor market outcomes. The Journal of human resources, 30(3), 409–438.
Rittle-Johnson, B., Adler, R., & Durkin, K. (2024). Predicting Marginalized Students’ Mathematics Achievement in High School. Journal of Cognition and Development, 25(5), 732–753. https://doi.org/10.1080/15248372.2024.2384547
Duncan, G. J., Dowsett, C. J., Claessens, A., Magnuson, K., Huston, A. C., Klebanov, P., Pagani, L. S., et al. (2007). School readiness and later achievement. Developmental Psychology, 43(6), 1428–1446.
Lauen, D. L., & Tomberlin, T. R. (2018). North Carolina K-12 Achievement. Raleigh, NC: myFutureNC.
Murnane, R. J., Willett, J. B., & Levy, F. (1995). The growing importance of cognitive skills in wage determination. The review of economics and statistics, 77(2), 251.
Rose, H., & Betts, J. R. (2001). Math Matters: The Links Between High School Curriculum, College Graduation, and Earnings. San Francisco, CA: Public Policy Institute of California.
Siegler, R. S., Duncan, G. J., Davis-Kean, P. E., Duckworth, K., Claessens, A., Engel, M., Susperreguy, M. I., et al. (2012). Early predictors of high school mathematics achievement. Psychological Science, 23(7), 691–697.
Woessmann, L. (2024). Skills and earnings: A multidimensional perspective on human capital. Annual Review of Economics, 17.
FAQ
What test levels correspond to college-and-career-ready scores?
Students are classified as college-and-career-ready if they score at Level 4 or Level 5 on the end-of-grade exam. Both scores are considered on track for college and career:
- Level 4 demonstrates a thorough understanding of grade level content standards.
- Level 5 demonstrates a comprehensive understanding of grade level content standards and indicates that the student is prepared for advanced content in their next grade or course.
Is college-and-career-ready the same as grade level proficient?
No. College-and-career-ready is a more rigorous standard than grade level proficient. Students who score at a Level 3 on end-of-grade exams are considered grade level proficient. Level 3 demonstrates a sufficient understanding of grade level content standards, but these students may need some support to succeed with content in their next grade or course.
Are North Carolina’s end-of-grade exams the same as NAEP?
No. NAEP exams are not comparable to end-of-grade exams. The National Assessment of Educational Progress is “a national assessment of students at different ages and in different subjects. Data is reported every two years, and North Carolina looks at the NAEP math grade reading assessment scores to determine how NC students are doing in math proficiency over time and compared to the national average. Since the NAEP is a sample of fourth graders, rather than assessing every fourth-grader in the state, NAEP data is not available at the school district or county level.”


