Percentage of students beginning postsecondary education at a North Carolina institution and continue to a second year of enrollment at any postsecondary institution
* Demographic group segmentation not available for this indicator
Last updated: 2025
= Top southern state :
only available for totals, not available for all indicators
What does First-Year Persistence Rate mean?
Percent of first-year students beginning postsecondary education at a North Carolina institution who are still enrolled in any postsecondary program one year later.
The persistence rate is a more comprehensive metric of whether students continue their postsecondary enrollment than the retention rate, which measures the share of students who are enrolled at the same postsecondary institution one year later.
Persistence rates measure how well students are continuing in their education; retention rates measure how well institutions retain their first-year students.
What does this data show?
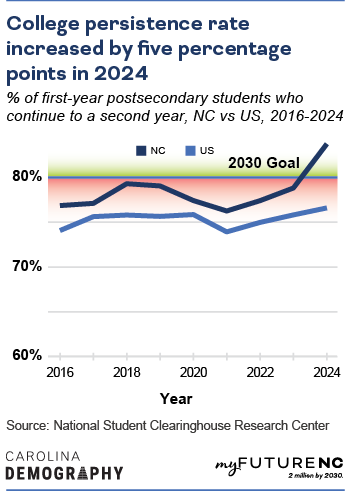
North Carolina’s first-year persistence rate was 84%, placing our state 11th among all states and first among southern states in 2024, and surpassing our state goal of 80% by 2030. The District of Columbia had the highest first-year persistence rate overall (92%).
By 2030, the goal is to have 80% of North Carolina’s first-year undergraduate students persist to their second year. This goal was set by the myFutureNC Commission.
Why does First-Year Persistence Rate matter?
Initial enrollment in a postsecondary program is just the first step toward the goal of postsecondary degree or certificate attainment. Following enrollment, students must continue their enrollment to degree completion, typically referred to as persistence. First-year persistence rates are a key indicator, as the greatest share of postsecondary dropouts occur during the first year than any other time.
There are two general ways to measure how well students are continuing through their postsecondary education: Persistence and Retention. There are well-documented differences in student persistence and retention by:
- type of program (two-year versus four-year);
- institutional sector (public versus private);
- institutional selectivity and academic readiness;
- intensity of attendance (full time versus part time); and
- the sociodemographic characteristics of the student and their family.
These characteristics are often interrelated. For example, economic disadvantage is associated with lower academic readiness, and such students are more likely to enroll part-time or at less selective institutions. These students may be more likely to face academic or financial challenges during their first year, resulting in lower overall persistence. First-generation college students may have a more difficult time navigating college, leading to lower persistence rates as compared to students whose parents have completed some postsecondary education. Research on the first-year persistence rates of North Carolina high school graduates is consistent with past research using national samples.
Persistence to degree completion is a challenge for both individual students and the institutions they attend, and overall patterns of persistence and retention can amplify and exacerbate inequalities shown in college access. At the state level, increases in persistence rates increase the likelihood of degree completions. Having a postsecondary degree is related to better health and economic outcomes as compared to not having a postsecondary degree.
How is North Carolina performing?
Meeting the 2030 Goal
In 2024, North Carolina met the goal of at least 80% of first-year students continuing to their second year of postsecondary.

In 2016, North Carolina’s first-year persistence rate was 77%, ranking 24th among all states. From 2016 to 2023, first-year persistence rate of North Carolina undergraduates has consistently been around the 2016 rate of 77%, rising to a high of 79% in 2018 and 2019. In 2024, North Carolina’s first-year persistence rate hit a peak of 84%, a five percentage point increase from 2023.
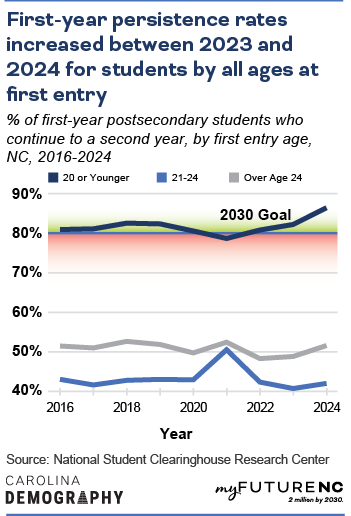
Students who enter college at ages 20 or younger consistently have higher persistence rates than students who enter at older ages. First-year persistence rates increased for all ages between 2023 and 2024, 86% of students who entered college at ages 20 and younger continued to a second year of college (the largest increase of all age-groups with a four percentage point increase), compared to 41% of students who entered between ages 21 and 24, and 52% of students who entered college at ages 25 or older.

Methodology
Where does the data for the First-Year Persistence Rate come from?
The data for first-year persistence by state was downloaded from the National Student Clearinghouse (NSC) Research Center.
The NSC is a nonprofit organization that provides postsecondary enrollment data and verification for more than 3,750 colleges and universities in the United States.
How was the data calculated?
This was a direct download from the NSC Research Center.
Who is included?
The first-year persistence rate is limited to first-time fall enrollments who persist to the second fall. First-time means that students were not previously enrolled in college and had not previously completed a degree or a certificate. Former dual enrollment students are included if “their enrollment or degree record prior to the entering cohort year was before the student turned 18 years old.” Fall enrollment means an enrollment term that began between August 1 and October 31, ended between September 15 and November 30, or began before August 15 and ended after November 30. Note that the first-year persistence rates here are different from those on the myFutureNC County Profiles. The rates here include students who enroll at any age, where the first-year persistence rates on our county profiles only include graduates from NCDPI high schools who enroll in college within 12 months of their high school graduation date and continue to their second year of college.
Who isn’t included?
Collectively, the institutions covered by the NSC data serve 97% of all postsecondary students nationwide and 98% of students in North Carolina. The NSC data does not cover all institutional sectors equally, however, and has lower coverage rates of coverage for for-profit institutions. More details on NSC coverage are available here.
Former dual‑enrollment students will be excluded if, before the cohort year, they had an enrollment or degree record dated after their 18th birthday
The data used in the development of this indicator is derived from administrative records and is subject to non-sampling error.
In the 2025 report, National Student Clearinghouse revised numbers from prior years based on newer and additional data received. In the 2025 report, the definition of Fall semester changed from a semester that began between August 15 and November 30 to include a semester that ended between September 15 and November 30 or began before August 15 and ended after November 30.
Learn more
Who is working on this in NC?
Help improve this section
If you know of an organization that is working on this topic in NC, please let us know on the feedback form.
NC-focused, state-level dashboards
Name: UNC System Dashboards
Website: https://www.northcarolina.edu/impact/stats-data-reports/
About: The UNC Data Dashboard is an interactive, online database that gives students, parents, policymakers and taxpayers expanded access to detailed system data on selected core measures.
Name: NCCCS Dashboards
Website: https://www.nccommunitycolleges.edu/analytics/dashboards
About: The North Carolina Community College System (NCCCS) dashboards allow users to explore and interact with NCCCS data by theme. The dashboards are designed to help colleges access the data and information needed to facilitate institutional effectiveness and program improvement. Dashboards include system and college-level data views, disaggregations, historical trends, and peer comparisons.
Further research and literature
Babineau, K. (2018). Closing the Gap: An Overview of the Literature on College Persistence and Underrepresented Populations. New Orleans, LA: Cowen Institute.
Burrus, J., Elliott, D., Brenneman, M., Markle, R., Carney, L., Moore, G., Betancourt, A., et al. (2013). Putting and Keeping Students on Track: Toward a Comprehensive Model of College Persistence and Goal Attainment. Princeton, NJ: ETS.
Crissman Ishler, J. L., & Upcraft, M. L. (2005). The keys to first-year student persistence 27-46. In Upcraft, Gardner, & Barefoot (Eds.), Challenging and supporting the first-year student: A handbook for improving the first year of college. San Francisco: Jossey-Bass.
Mattern, K. D., Marini, J. P., & Shaw, E. J. (2015). Identification of multiple nonreturner profiles to inform the development of targeted college retention interventions. Journal of College Student Retention: Research, Theory & Practice, 17(1), 18–43.
National Student Clearinghouse Research Center. (2019). Persistence & Retention – 2019. Herndon, VA: NSC Research Center.
Ross, T., Kena, G., Rathbun, A., Kewal Ramani, A., Zhang, J., Kristapovich, P., & Manning, E. (2012). Higher Education: Gaps in Access and Persistence Study (NCES 2012-046). U.S. Department of Education, National Center for Education Statistics. Washington, DC: Government Printing Office.
Stewart, S., Lim, D. H., & Kim, J. (2015). Factors influencing college persistence for first-time students. Journal of Developmental Education, 38(3), 12-20.
Tippett, R., & Kahn, N. (2018). Postsecondary Persistence Report: 2009-2016 North Carolina Public High School Graduates. Raleigh, NC: myFutureNC.
FAQ
What is the difference between retention rates and persistence rates?
Retention and persistence are both metrics that capture a student’s progress through postsecondary:
- Institutions retain. Retention rates capture the share of students who continue enrollment within the same higher education institution or system.
- Individuals persist. Persistence rates capture the share of students who continue enrollment at any higher education institution in the following year, even if this is a different institution or system than the one at which the student initially enrolled.
Because retention rates are limited to progress within the same initial institution, they are lower than persistence rates.


