Percentage of North Carolina residents aged 25-44 participating in the labor force
Data year: 2023
= Top southern state :
only available for totals, not available for all indicators
What does Labor Force Participation Rate mean?
Percent of North Carolina prime working-age adults (ages 25-44) who are either employed or actively looking for work.
What does this data show?
More than eight in every ten—84%—of North Carolina’s prime working-age adults, ages 25-44 were in the labor force in 2023, the 30th highest rate among the states. In Virginia, the southern state with the highest rate, this proportion was 85%. Nationally, the District of Colombia had the highest labor force participation rate overall (92%).
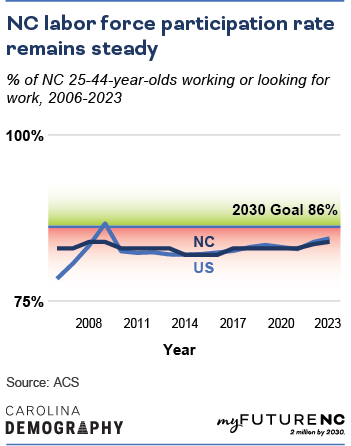
By 2030, the goal is to have 86% of North Carolina’s prime working-age (25-44) adults participating in the labor force.
Why does Labor Force Participation Rate matter?
Labor force participation rates reflect a combination of factors, including the availability of jobs, an individual’s ability and willingness to work, as well as labor market alignment or barriers between individual skills and available jobs. It is an important measure of the labor market as it “represents the relative amount of labor resources available for the production of goods and services.”
Individuals are in the labor force if they are either employed or unemployed and actively looking for work. Labor force participation rates differ across groups, and there are various factors that relate to participation in the labor force, such as:
- Birth cohort or generation
- Education level
- Disability
- Incarceration
Labor force participation rates are historically lower for:
- Women
- People with less education
- People with disabilities
- Unmarried men and married women
- Women who have children under 5 at home
How is North Carolina performing?
Meeting the 2030 Goal
North Carolina needs 56,863 more 25-44-year-olds to participate in the labor force to meet the statewide goal.
 Trends
The share of North Carolina adults ages 25-44 participating in the labor force has held steady since 2006 when it was 83%. Over the past twelve years, the labor force participation ranged from a high of 84% in 2008 to a low of 82% in 2015. This rate increased to 84% in 2023, back up to the high in 2008. North Carolina saw no change in the labor force participation rate between 2022 and 2023 with the rate remaining at 84%, two percentage points below the state goal of 86%.
By geography
Urban North Carolina counties had the highest labor force participation rates in 2023 (86%), followed by suburban counties (84%). Labor force participation rates were lower in rural counties: non-metropolitan rural counties had the lowest labor force participation rates (78%) while rates were higher in metropolitan rural counties (80%).

By sex
Men are more likely to be in the labor force than women. Nearly nine in every ten North Carolina men ages 25-44 are in the labor force compared to nearly eight in every ten women (89% vs. 79%).
By race/ethnicity
Labor force participation rates were highest among White residents (86%), closely followed by Multiracial residents (85%). Black residents (83%) had the next highest rate followed by Asian residents (82%) and Hispanic residents (80%). Labor force participation rates were lowest among American Indian (71%) residents.
By race/ethnicity and sex
On average, men are more likely to be in the labor force than women. These differences are most pronounced among Hispanic adults closely followed by Asian adults. Hispanic men are 1.34 times more likely to be in the labor force than Hispanic women. Asian men are 1.28 times more likely to be in the labor force than Asian women. But this pattern does not hold for all racial/ethnic groups. Black women were more likely to be in the labor force than Black men, though with a small gap. American Indian women are slightly more likely to be in the labor force than American Indian men.
Asian men and Hispanic men have the highest labor force participation rates—92%— closely followed White men (91%). Hispanic women (69%) and American Indian women (67%) had the lowest labor force participation rates.
Methodology
Where does the data for the labor force participation rate come from?
Data on labor force participation are from the U.S. Census Bureau’s American Community Survey (ACS). This annual survey of demographic, economic, and social characteristics has been collected for all households and group quarters populations since 2006. The Public Use Microdata Series (PUMS) contains anonymized person-level observations that enable custom tabulations of the data for the state and some counties. Data for all counties is available in the 5-Year ACS in Table B23001: Sex by Age by Employment Status for the Population 16 Years and Over.
How was the data calculated?
Carolina Demography calculated the labor force participation rate using ACS PUMS data retrieved from IPUMS-USA. Individuals were identified as being in the labor force if they reported being employed or unemployed.
The labor force participation rate was calculated by dividing the estimated number of adults ages 25-44 who are in the labor force by the total number of adults ages 25-44.

Who is included?
All residents of North Carolina ages 25-44. Unpaid family workers are classified as in the labor force.
Who isn’t included?
Individuals who are not seeking work for any reason—whether because they are in school, retired, taking care of family members, or because of a disability—are classified as “not in labor force.” Individuals who are currently incarcerated are “not in the labor force.”
Certain types of group quarters facilities are not sampled in the ACS due to difficulties associated with data collection, such as domestic violence shelters, soup kitchens, and living quarters for victims of natural disasters. Full details on the ACS sample and methodology are available here.
The data used in the development of this indicator is derived from a survey and is subject to sampling and non-sampling error.
Learn more
Who is working on this in NC?
Help improve this section
If you know of an organization that is working on this topic in NC, please let us know on the feedback form.
NC-focused, state-level dashboards
Name: NC Chamber Dashboard
Website: https://ncchamber.com/dashboard/
About: The NC Chamber Dashboard informs dialogue and catalyzes action to address North Carolina’s economic development challenges and opportunities. It provides independent and objective data on leading indicators in four critical areas important for state and business competitiveness.
Name: NC Workforce Development Board Dashboard
Website: https://bi.nc.gov/t/COM-LEAD/views/NorthCarolinaWDBDashboard/ImpactsSummary
About: This tool displays information on the services rendered, participants served, and outcomes achieved through the state’s Workforce Development Boards.
Name: NC Labor Supply/Demand Analyzer
Website: https://nccareers.org/s-d/
About: Developed by the NC Department of Commerce, this tool tracks the tightness of the state’s labor market and view estimates of the number of jobseekers and job openings.
Name: NC Works Labor Market Indicator Dashboard
Website: https://www.ncworks.gov/vosnet/Default.aspx
About: Find Labor Market Information Data such as occupation information, wage information, unemployment rates, advertised job posting statistics, demographic information, and more.
Further research and literature
Berger-Gross, A. (2016, November 3). NC Commerce: Why Are Fewer North Carolinians Participating in the Labor Force? The LEAD Feed. Retrieved December 18, 2019, from https://www.nccommerce.com/blog/2016/11/03/why-are-fewer-north-carolinians-participating-labor-force
Congressional Budget Office. (2018). Factors Affecting the Labor Force Participation of People Ages 25 to 54. Washington, DC: Congressional Budget Office.
Dotsey, M., Fujita, S., & Rudanko, L. (2017). Where Is Everybody? The Shrinking Labor Force Participation Rate. Philadelphia, PA: Federal Reserve Bank of Philadelphia Research Department.
Hipple, Steven F, “Labor force participation: what has happened since the peak?,” Monthly Labor Review, U.S. Bureau of Labor Statistics, September 2016, https://doi.org/10.21916/mlr.2016.43.
Rios-Avila, F. (2015). Losing Ground: Demographic Trends in US Labor Force Participation. Hudson, NY: Levy Economics Institute of Bard College.
FAQ
Is this the same thing as the “official” labor force participation rate?
No. The “official” measure of labor force participation is based on the Current Population Survey (CPS), not the American Community Survey (ACS). The ACS and CPS measures of labor force participation rate differ due to differences in both methodology and coverage.
We use the ACS for two reasons: First, the myFutureNC goal is focused on 25-44-year-olds and the ACS allows us to examine this population in detail. Second, we are also developing county profiles and the ACS provides insight on labor force participation, by age, at the county level; this level of detail is not available in the CPS.


